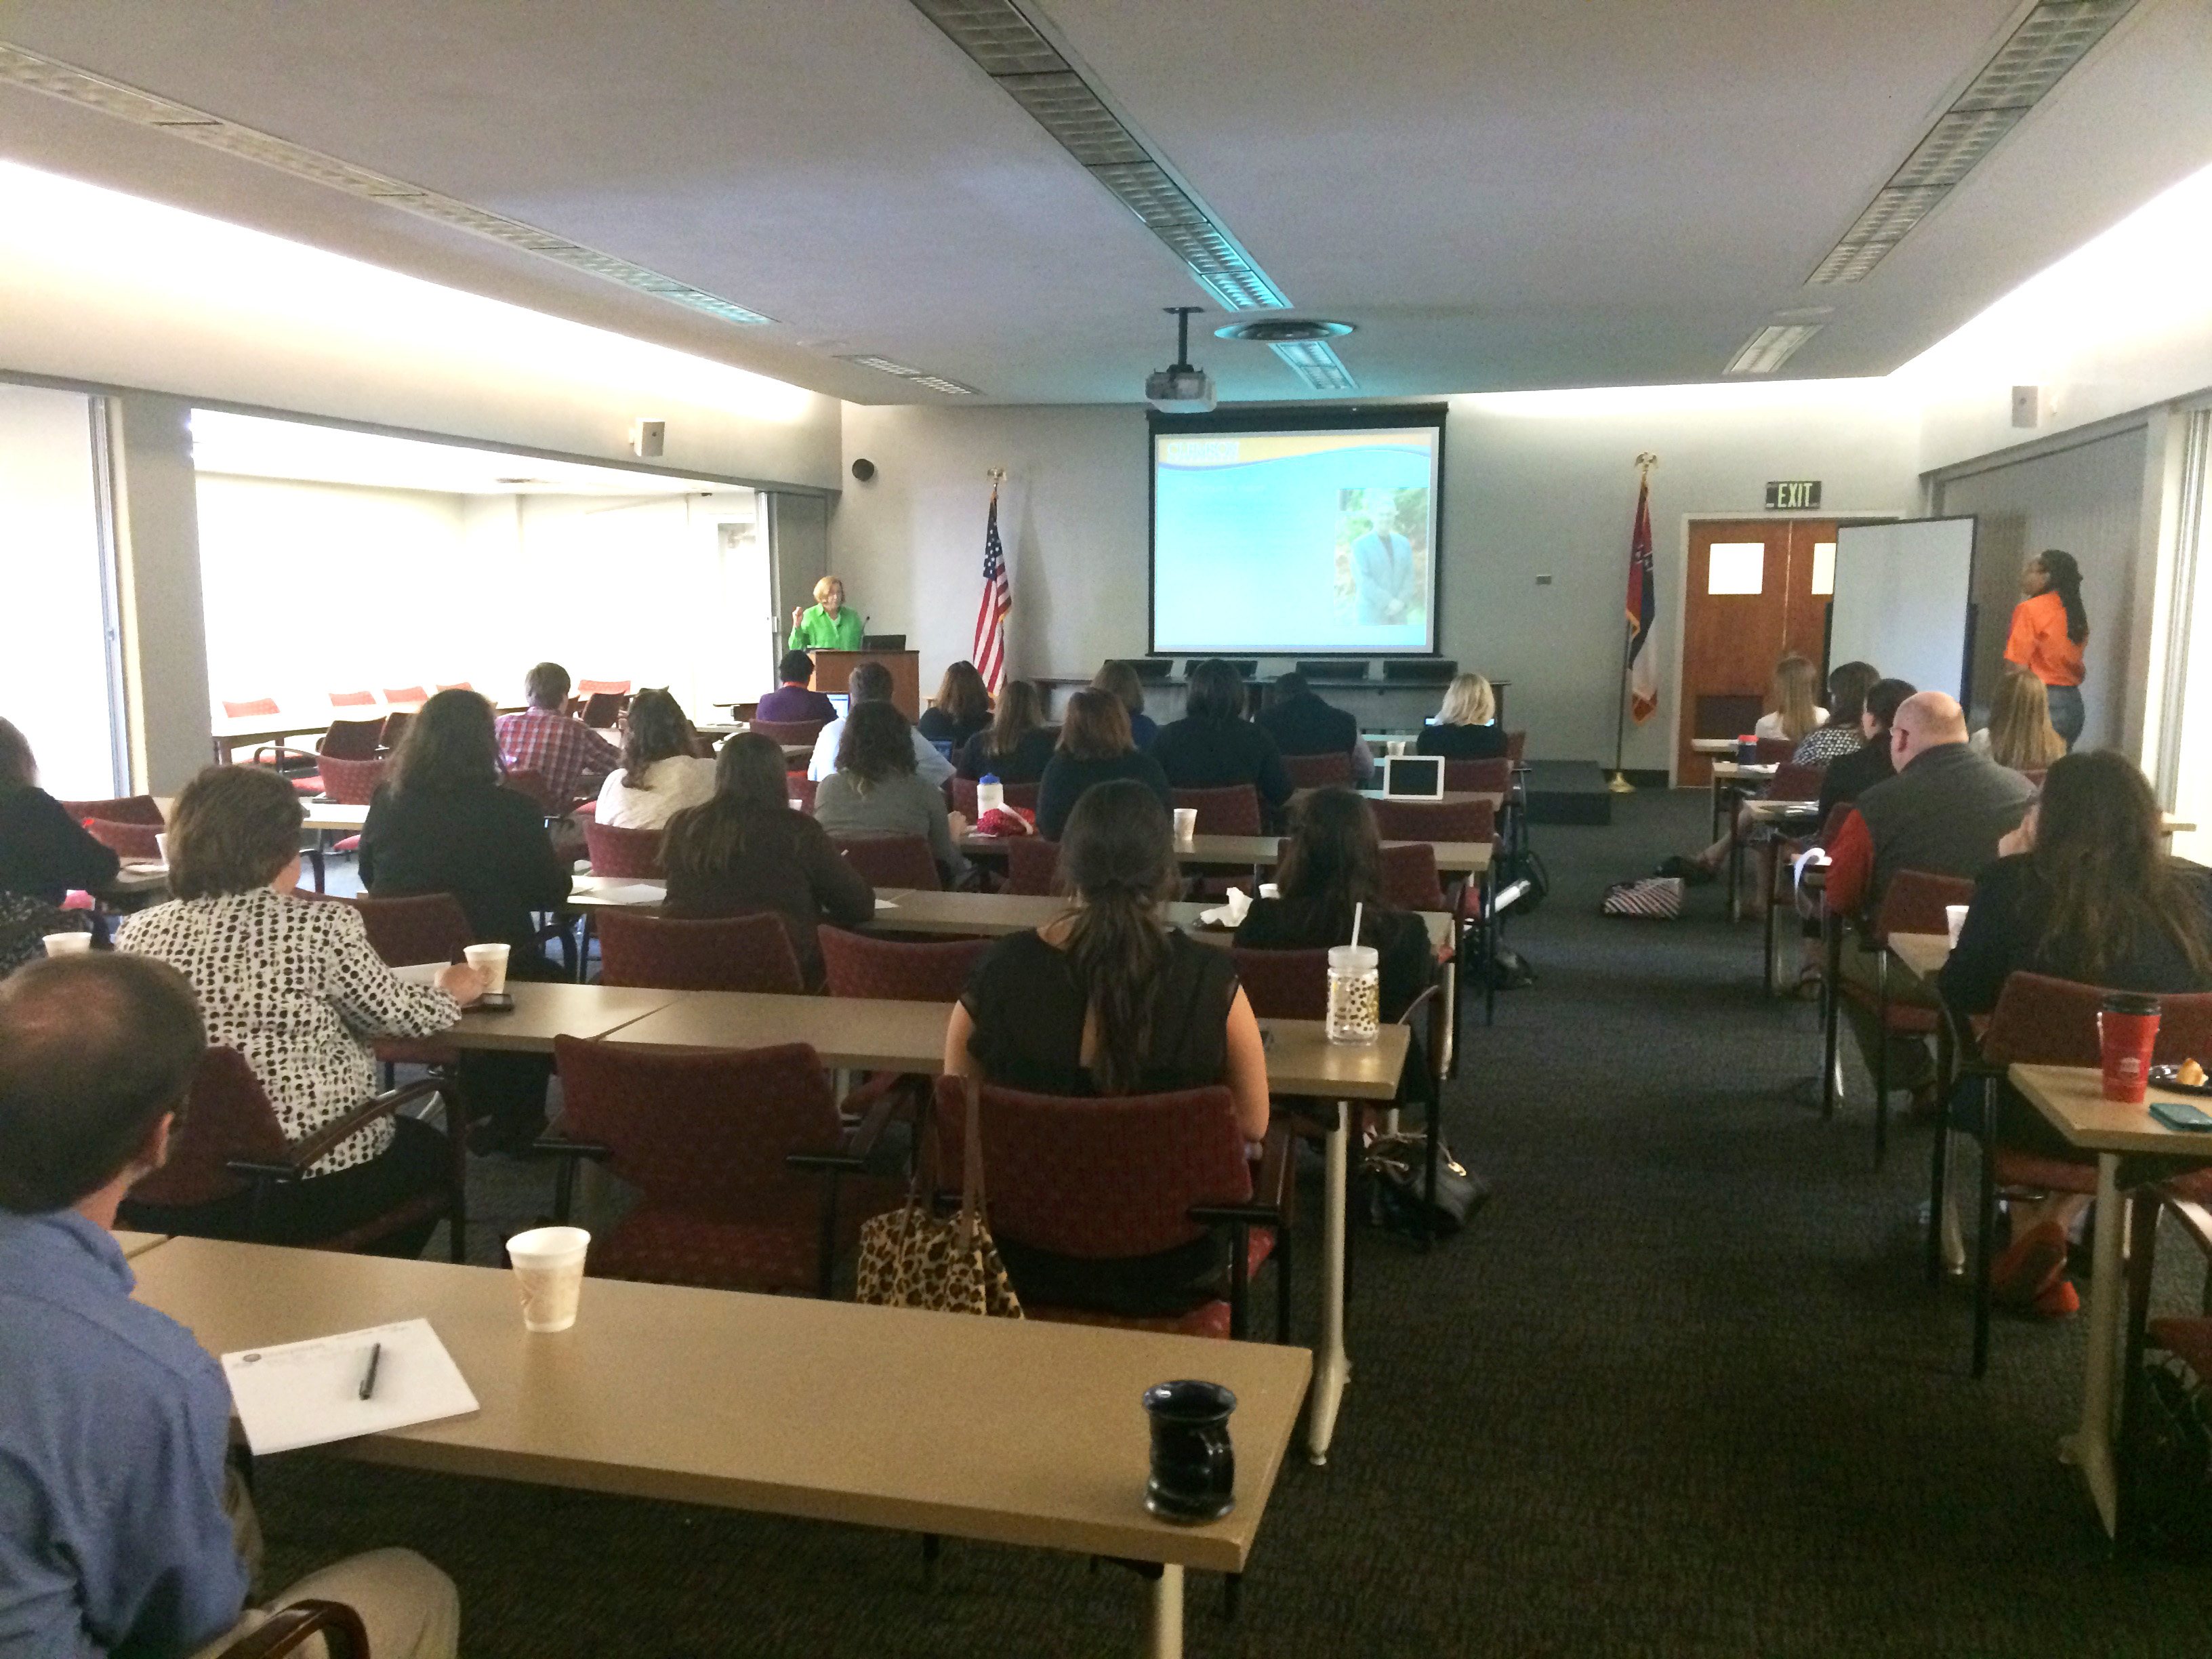
Barbara Weaver of the Clemson University Social Media Listening Center talks about the center’s current research endeavors at the Ole Miss Social Media Summit held Wednesday, April 23, 2014.
I’ve been off the grid for the past few days in an attempt to pull together a conference that has long been one of our department’s goals. Earlier this week, nearly 40 Ole Miss faculty and staff members gathered to hear from social media thought leaders from around the country.
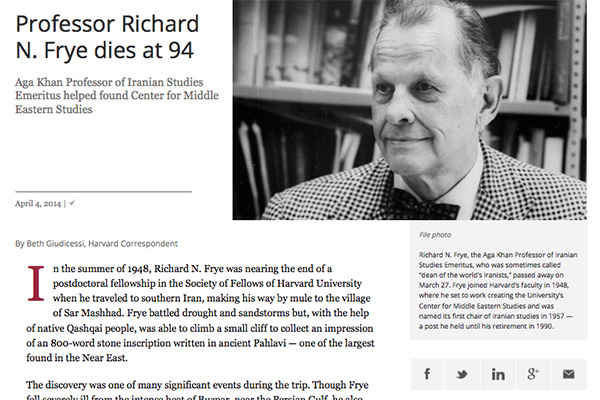
Of the three different organizations that presented at the 2014 Ole Miss Social Media Summit, Harvard University’s Mike Petroff brought up one interesting concept that I’m almost certain you may see reflected on future Ole Miss websites.
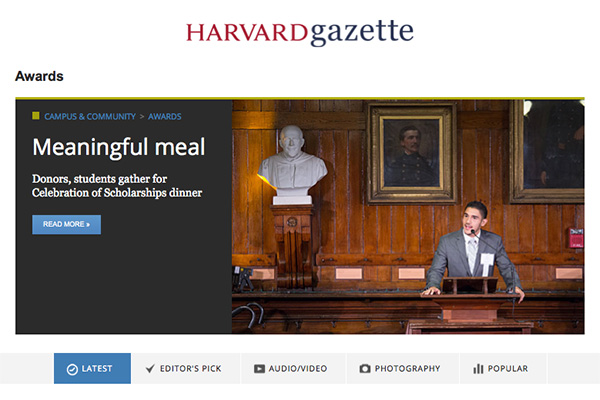
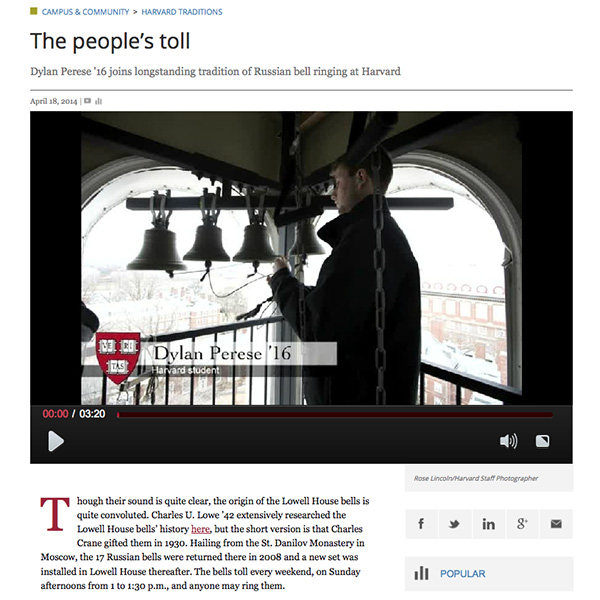
Petroff is a digital content strategist at Harvard and played a key role in the redesign of the Gazette, the university’s magazine-style news site. According to Petroff, one of the key strategies of the site is making data visual.
So what does it mean for you? Quite simply, making data more visual throughout our news site will make it easier on you. In previous years, the Ole Miss News site has acted as a repository for UM Communications’ news releases and the occasional video. While the information was interesting, it rarely left web users wanting more. Stories were long and sometimes did not even include photos.
Enter the 21st century. Web users are reading less text than ever before. Way back in 2008, Jakob Nielson of the Nielson Norman Group shared data which proved that the average web user doesn’t read 80% of each page they visit. Fast forward to 2014, little has changed. Last year, Farhad Manjoo of Slate.com said ‘we live in the age of skimming,’ and not only would I tend to agree (I’ll admit, I’m a scanner), analytics from Ole Miss News prove that point.
How else can we share information with an audience that is becoming increasingly bored and disconnected with words on a page? By sharing data that is more visual. Whether that be creating snazzy infographics, shorter and more powerful videos, or even utilizing more photography throughout our stories, our job is to make sure that this generation of web users stay on our pages as long as possible.
While I don’t have a specific date that the new look will go live on Ole Miss News, I can say that if it’s anything like Harvard’s Gazette, users are in for a treat. Here’s a few screenshots to whet your appetite: